Net Zero Emission
QTC Energy Public Company Limited recognizes and places importance on its social and environmental responsibilities. The Company intends to establish greenhouse gas emission reduction targets aligned with the Paris Agreement, which aims to limit the global temperature increase to no more than 1.5 degrees Celsius. The Company is committed to providing the personnel and resources necessary to implement organizational plans or activities for reducing or removing greenhouse gas emissions in order to achieve the following targets:
- Achieve net zero greenhouse gas emissions (Net Zero) by 2050
- A 5-year greenhouse gas reduction target (Net Zero Pathway) has been established, with the objective of reducing greenhouse gas emissions in Scopes 1,2 and 3 by 21 percent by 2028 compared with the base year 2022 and progressing toward net zero greenhouse gas emissions by 2050
Reporting Boundary
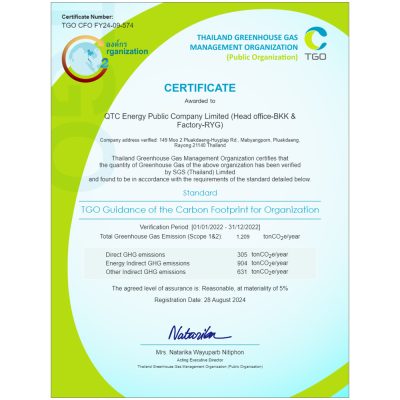
Greenhouse gas emission sources considered for QTC Energy Public Company Limited cover the Bangkok head office and the factory area in Rayong Province, using the OPERATIONAL CONTROL (OPERATIONAL CONTROL)
Net Zero Pathway
Target : Reduce greenhouse gas emissions in Scopes 1,2 and 3 by 21 percent by 2028
| รายละเอียด | Base Year | Year of Launch Net Zero Pathway | Target Year Net Zero Pathway (5 Year) | Target Year Net ZERO | % Reduction per year |
|---|---|---|---|---|---|
| 2022 | 2024 | 2028 | 2050 | ||
| Scope 1 (Ton CO2e) | 304 | 284 | 240 | 0 | 3.57% |
| Scope 2 (Ton CO2e) | 904 | 839 | 710 | 0 | 3.57% |
| Scope 3 (Ton CO2e) | 631 | 586 | 496 | 0 | 3.57% |
| Total (Scope 1+2+3) (Ton CO2e) | 1,840 | 1,709 | 1,446 | 0 | 3.57% |
Strategy: Reduce greenhouse gas emissions by increasing the use of clean energy in business processes.
Operational Plan


Pathway to Net Zero (5 Year) Greenhouse Gas Management Working Group 2024-2028

Scope of reporting
Greenhouse gas emissions compared to base year 2022

Greenhouse Gas Emission Reduction Project
Greenhouse Gas Emission Reduction Project Plan Based on Pathway to Net Zero (5 Years)

Operations in 2025
Solar rooftop installation project phase 1,2,3
Table showing the potential to reduce greenhouse gases from solar rooftop installation projects
| Potential to reduce greenhouse gases | Year 2024 | Year 2025 | ||||||
|---|---|---|---|---|---|---|---|---|
| GHG (Scope 1) | GHG (Scope 2) | GHG (Scope 3) | Total GHG | GHG (Scope 1) | GHG (Scope 2) | GHG (Scope 3) | Total GHG | |
| Predictable Amount Reduced by Pathway (tonCO2eq.) | – | 210.59 | 41.58 | 252.17 | – | 256.45 | 50.63 | 307.08 |
| Reduced volume in the year of operation (tonCO2eq.) | – | 134.04 | 26.47 | 160.51 | – | 210.70 | 41.60 | 252.30 |
| Differential (tonCO2eq.) | – | (76.55) | (15.11) | (91.66) | – | (45.75) | (9.03) | (54.79) |
| Energy savings (MJ) | 965,304.00 | 1,517,328.00 | ||||||
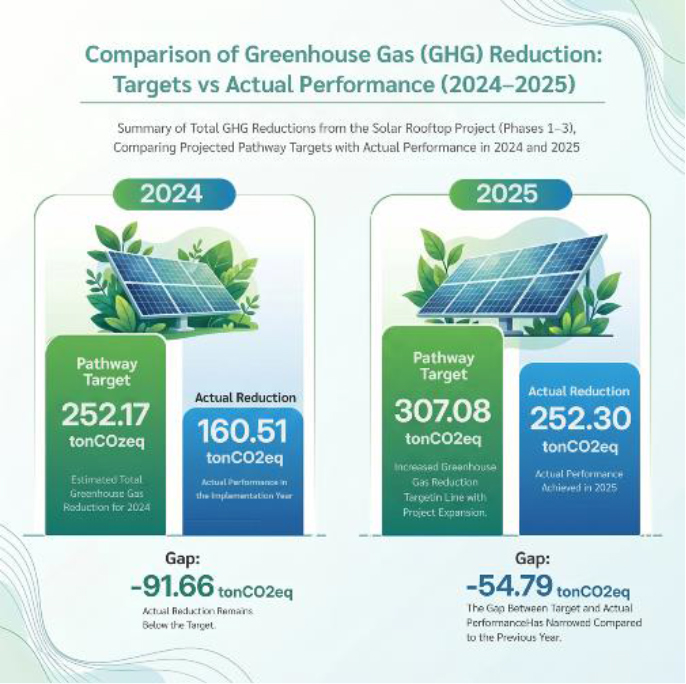
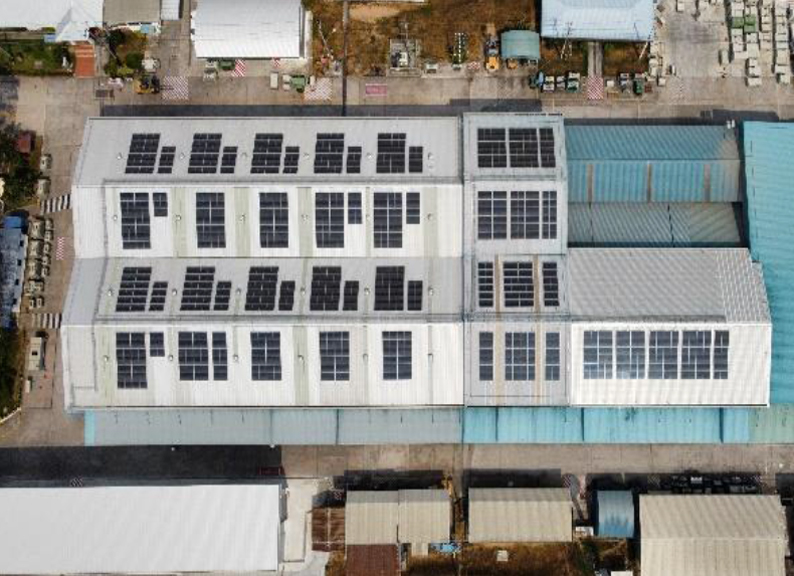
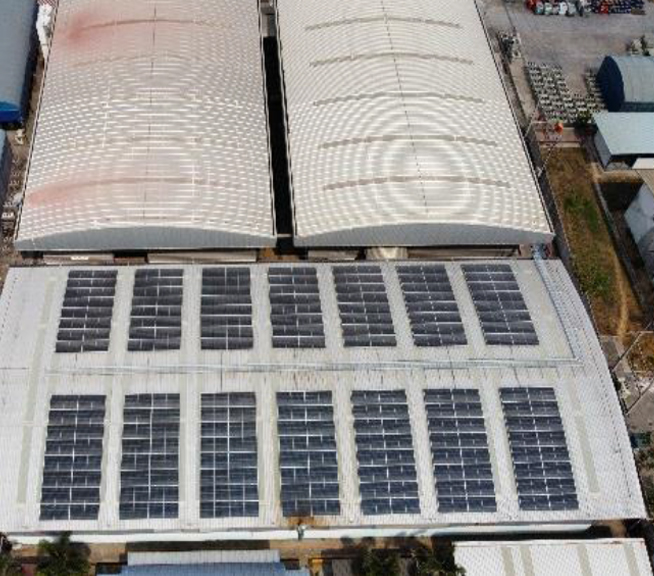
The Solar Rooftop Installation Project (Phases 1–3) is one of the Company’s key measures to reduce greenhouse gas emissions, with a focus on reducing electricity consumption from external distribution systems, which directly affects the reduction of greenhouse gas emissions in Scope 2 and Scope 3. In 2025, greenhouse gas emissions can be reduced to 252.30 tons of carbon dioxide equivalent, or about 82.1% of the target, reflecting the continuous improvement in project efficiency. Although the amount of greenhouse gas emission reductions is still lower than the projected target under the Pathway in both years, the trend demonstrates the project’s potential to support the company’s long-term greenhouse gas reduction goals and is an important base for a step-by-step path towards net-zero greenhouse gas emissions in the future.
Electric Forklift Replacement Project
The table shows the potential to reduce greenhouse gases from the electric cliff project
| Potential to reduce greenhouse gases | Year 2024 | Year 2025 | ||||||
|---|---|---|---|---|---|---|---|---|
| GHG (Scope 1) | GHG (Scope 2) | GHG (Scope 3) | Total GHG | GHG (Scope 1) | GHG (Scope 2) | GHG (Scope 3) | Total GHG | |
| Predictable Amount Reduced by Pathway (tonCO2eq.) | 9.70 | (1.30) | 0.70 | 9.11 | 14.55 | (1.95) | 1.06 | 13.66 |
| Reduced volume in the year of operation (tonCO2eq.) | 9.96 | (1.86) | 0.62 | 8.72 | 11.72 | (2.47) | 1.16 | 10.41 |
| Differential (tonCO2eq.) | 0.26 | (0.56) | (0.08) | (0.38) | (2.83) | (0.53) | 0.10 | (3.25) |
| Energy savings (MJ) | 105,235.69 | 123,847.10 | ||||||
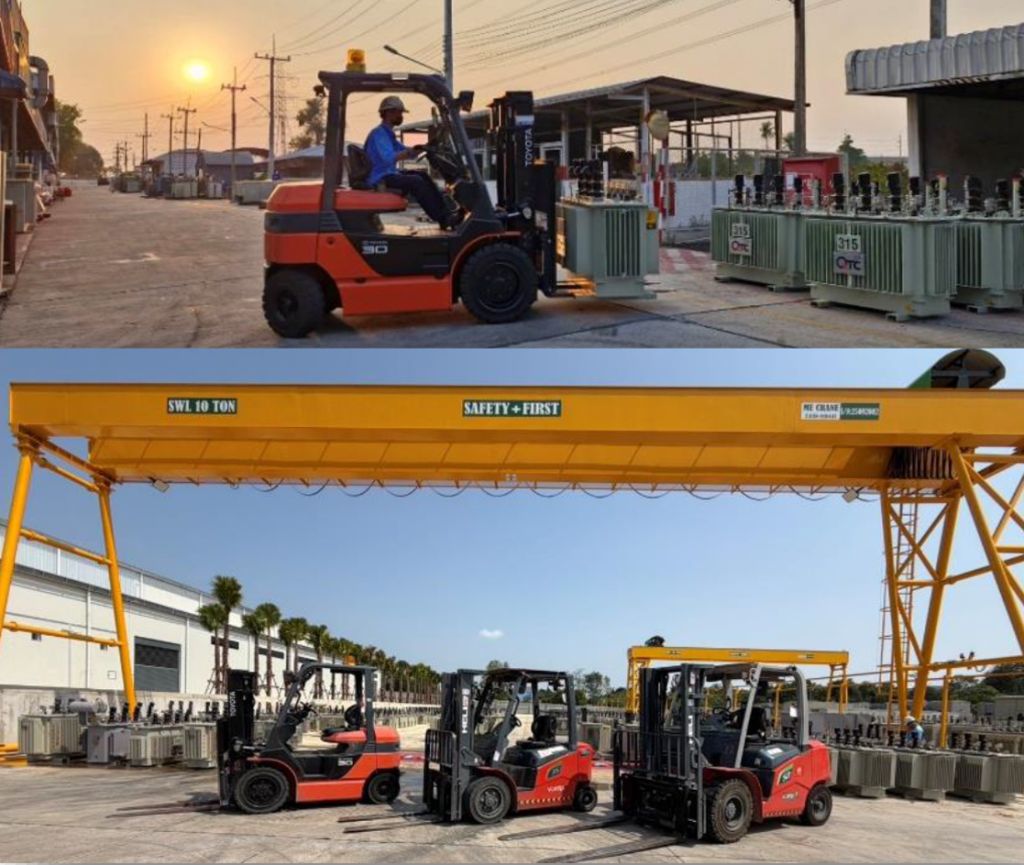
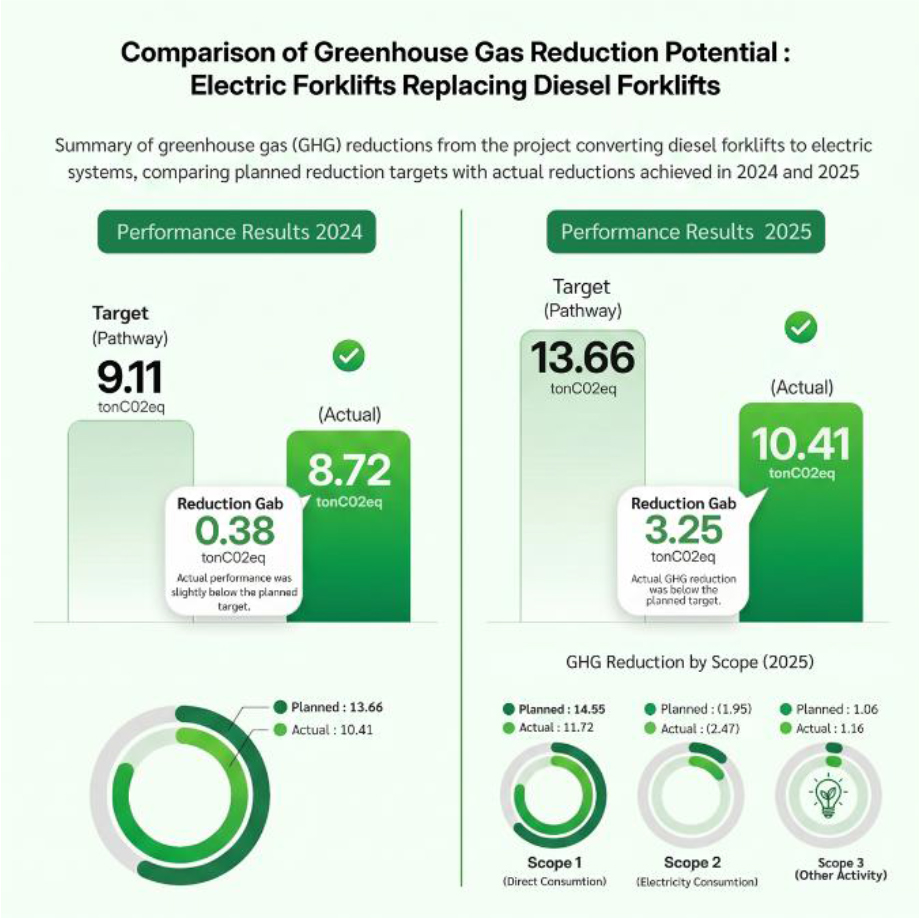
The project to replace diesel forklifts with electric forklifts is a key measure to reduce greenhouse gas (GHG) emissions from the Company’s operations. It primarily targets a reduction in Scope 1 emissions from fossil fuel consumption. Although there has been an increase in Scope 2 emissions from electricity usage, the overall results still demonstrate the environmental effectiveness of the project. In 2024, the Company achieved a total net reduction of 8.72 tonCO₂eq, which is close to the target projected in the Pathway, with Scope 1 emission reductions slightly exceeding the target. In 2025, the project delivered a total net reduction of 10.41 tonCO₂eq, which was 3.25 tonCO₂eq below the Pathway target. Nevertheless, the project reflects a positive direction in reducing reliance on fossil fuels and transitioning toward electrification in operational processes. The Company can leverage this analysis to review Pathway assumptions, enhance electricity management, and increase the share of renewable energy consumption in order to strengthen its GHG reduction performance and better align with future targets.
Project to change the executive vehicle from the E20 petrol car to the E20 hybrid vehicle
Table showing the potential to reduce greenhouse gases from the E20 hybrid vehicle conversion project.
| Potential to reduce greenhouse gases | Year 2024 | Year 2025 | ||||||
|---|---|---|---|---|---|---|---|---|
| GHG (Scope 1) | GHG (Scope 2) | GHG (Scope 3) | Total GHG | GHG (Scope 1) | GHG (Scope 2) | GHG (Scope 3) | Total GHG | |
| Predictable Amount Reduced by Pathway (tonCO2eq.) | 15.10 | – | 1.99 | 17.09 | 15.10 | – | 1.99 | 17.09 |
| Reduced volume in the year of operation (tonCO2eq.) | 6.61 | – | 0.87 | 7.48 | 11.30 | – | 1.49 | 12.79 |
| Differential (tonCO2eq.) | (8.48) | – | (1.12) | (9.60) | (3.80) | – | (0.50) | (4.30) |
| Energy savings (MJ) | 91,608.62 | 156,551.70 | ||||||


The project to replace executive vehicles from E20 fuel-powered cars to hybrid E20 vehicles is one of the measures aimed at reducing greenhouse gas (GHG) emissions from energy use in the organization’s transportation activities. The initiative focuses on reducing GHG emissions in Scope 1 from fuel combustion and Scope 3 from related resource consumption. In 2024, the Company achieved an actual reduction of 7.48 tonCO₂e, representing approximately 43.8% of the reduction projected in the Pathway. In 2025, the emission reduction increased to 12.79 tonCO₂e, or approximately 74.9% of the target. This reflects an improving trend in the project’s performance in line with the actual utilization of hybrid vehicles.
However, the achieved GHG reductions remained below the projected targets in both years, indicating limitations related to usage behavior and travel patterns. Nevertheless, the project continues to play a significant role in supporting GHG emission reduction in the organization’s energy consumption and serves as part of a gradual transition toward achieving net-zero greenhouse gas emissions in the long term.
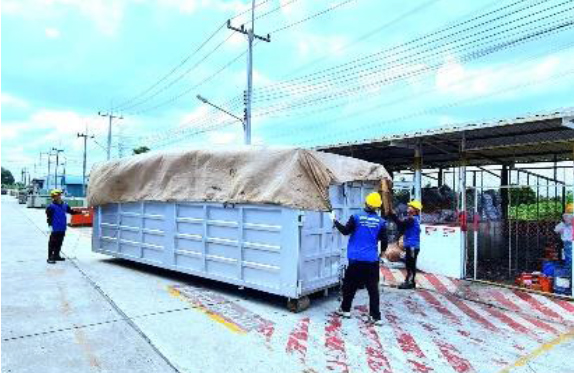
Waste separation project to reduce disposal in incinerators
The table shows the potential to reduce greenhouse gases from waste separation projects to reduce disposal in incinerators.
| Potential to reduce greenhouse gases | Year 2024 | Year 2025 | ||||||
|---|---|---|---|---|---|---|---|---|
| GHG (Scope 1) | GHG (Scope 2) | GHG (Scope 3) | Total GHG | GHG (Scope 1) | GHG (Scope 2) | GHG (Scope 3) | Total GHG | |
| Predictable Amount Reduced by Pathway (tonCO2eq.) | – | – | 57.73 | 57.73 | – | – | 57.73 | 57.73 |
| Reduced volume in the year of operation (tonCO2eq.) | – | – | 99.69 | 99.69 | – | – | 100.00 | 100.00 |
| Differential (tonCO2eq.) | – | – | 41.96 | 41.96 | – | – | 42.27 | 42.27 |
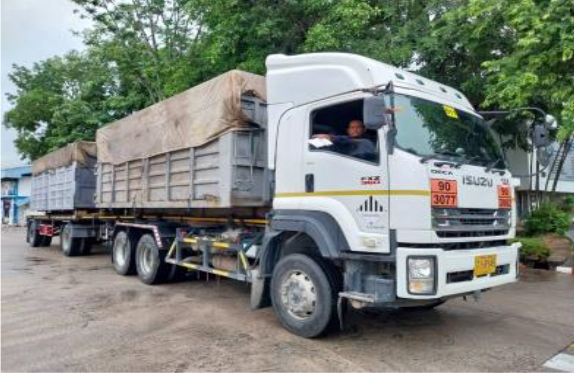
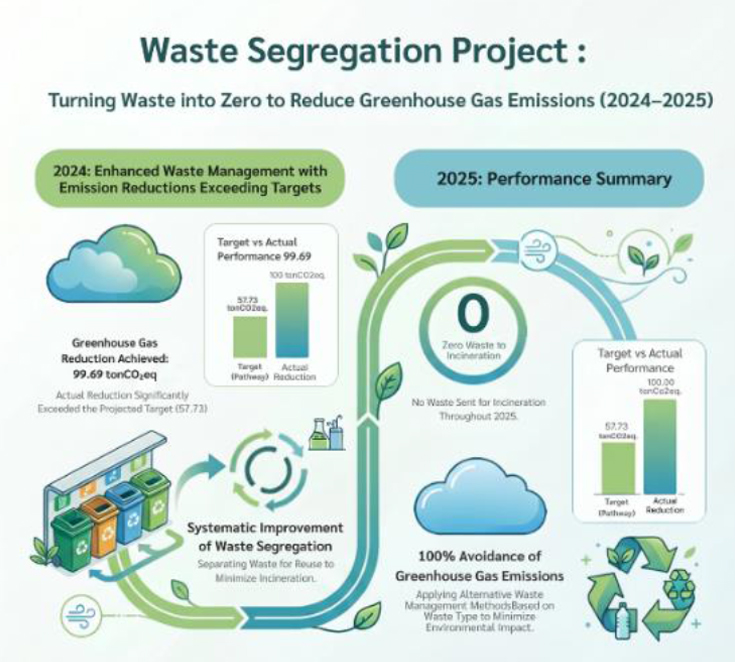
The Company places strong emphasis on effective waste management, with a focus on minimizing waste disposal through incineration, which contributes to Scope 3 greenhouse gas (GHG) emissions. The waste segregation project aimed at reducing incineration is therefore a key measure implemented to mitigate environmental impacts and promote efficient resource utilization in line with the circular economy concept.
In 2024, the Company systematically improved its waste segregation processes from operational activities by categorizing waste according to type and applying appropriate management methods, such as recycling, reuse, or alternative treatments instead of incineration. As a result, the Company significantly reduced the volume of waste sent for incineration and achieved better-than-expected GHG emission reductions compared with the Pathway projections. In 2025, the Company further enhanced its waste management practices, with zero waste being sent for incineration throughout the year. All generated waste was effectively segregated and managed using appropriate alternative methods based on its characteristics. This enabled the Company to completely avoid GHG emissions from incineration activities, achieving a 100% avoidance rate within the scope of such activities.
The project’s performance reflects the effectiveness of the waste segregation system and waste management approach in reducing environmental impacts from off-site disposal processes. It also supports the Company’s overall GHG emission reduction efforts and contributes to driving the organization toward environmentally responsible operations and a progressive transition to net-zero greenhouse gas emissions in the long term.
The project uses solar lighting to replace the old type of electric lamps.
The table shows the potential to reduce greenhouse gases from the Solar Lighting project with a total power of 11,563kWh/year.
| Potential to reduce greenhouse gases | Year 2024 | Year 2025 | ||||||
|---|---|---|---|---|---|---|---|---|
| GHG (Scope 1) | GHG (Scope 2) | GHG (Scope 3) | Total GHG | GHG (Scope 1) | GHG (Scope 2) | GHG (Scope 3) | Total GHG | |
| Potential to reduce greenhouse gases | – | – | – | – | – | 5.78 | 1.14 | 6.92 |
| Potential to reduce greenhouse gases | – | – | – | – | – | 4.15 | 0.82 | 4.97 |
| Potential to reduce greenhouse gases | – | – | – | – | – | (1.63) | (0.32) | (1.95) |
| Potential to reduce greenhouse gases | N/A | 29,875.39 | ||||||
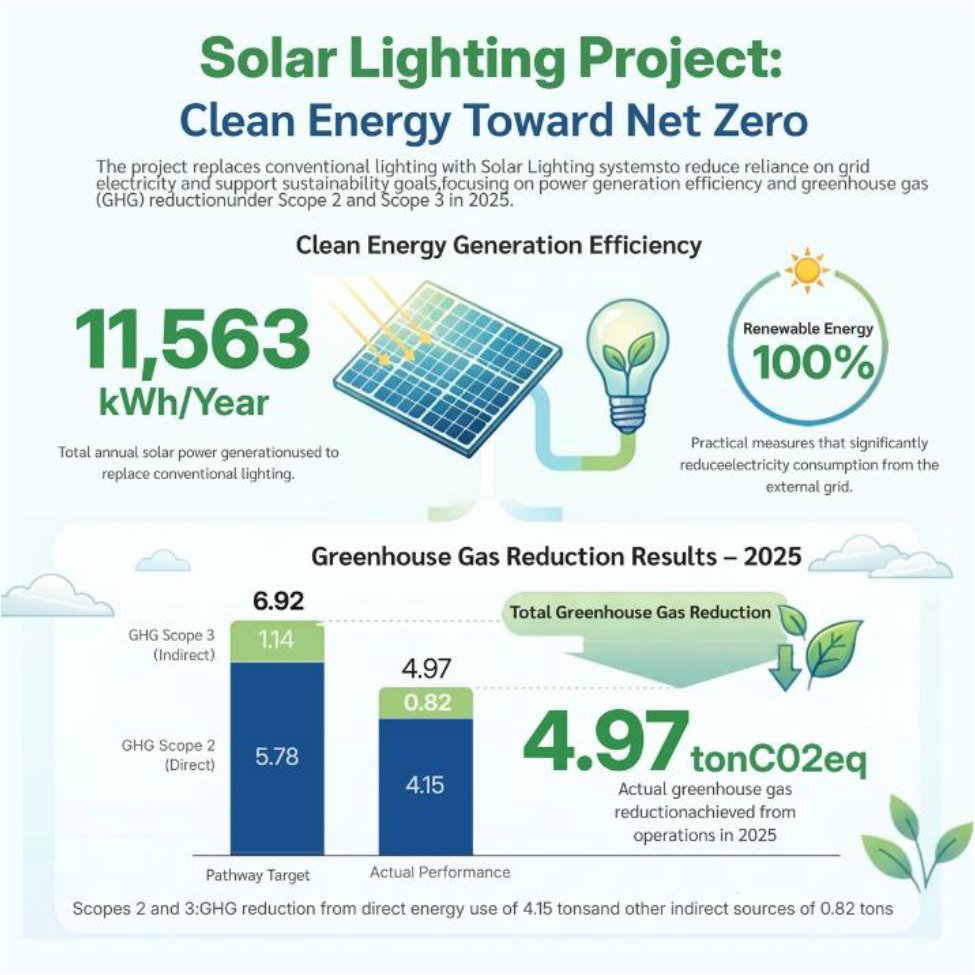
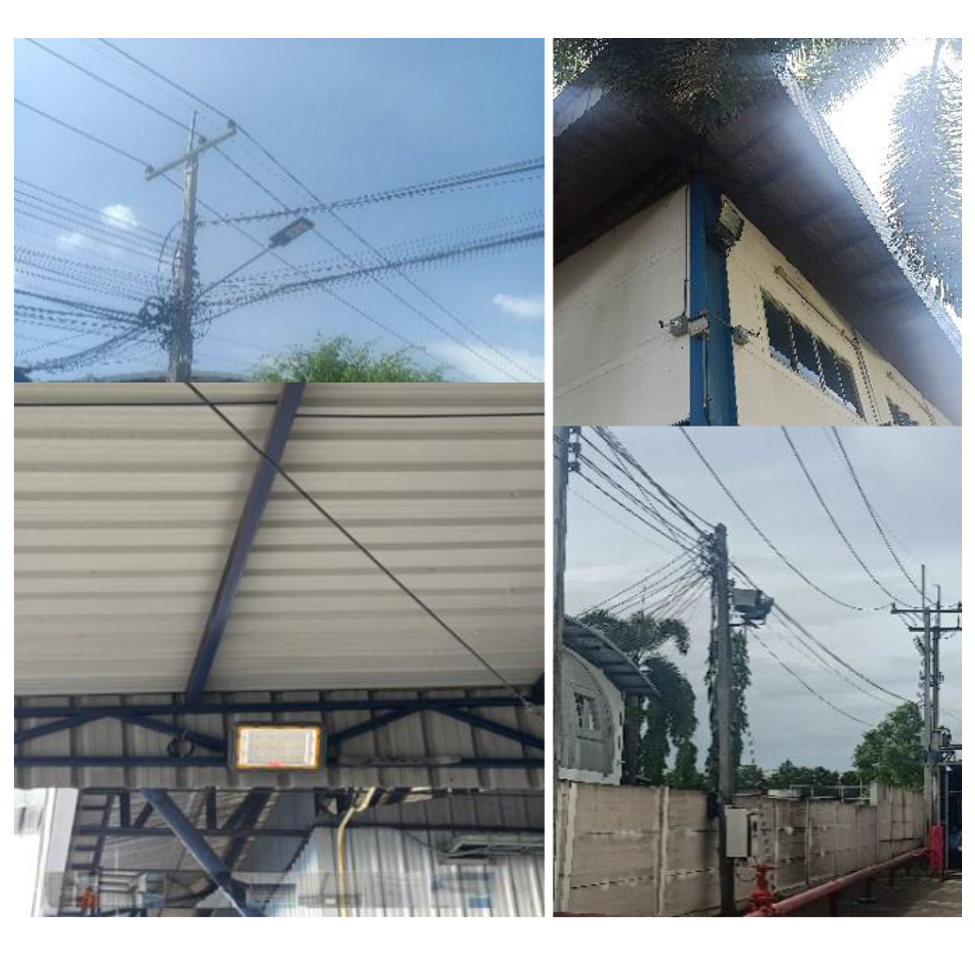
The Solar Lighting project, which replaces conventional lighting systems, is one of the Company’s renewable energy initiatives aimed at reducing electricity consumption from external grid supply and lowering associated greenhouse gas (GHG) emissions. The Solar Lighting system has a total annual electricity generation capacity of approximately 11,563 kWh, directly contributing to reductions in Scope 2 and Scope 3 emissions related to electricity usage. In 2025, the Company achieved an actual GHG emission reduction of 4.97 tonCO₂e, compared with the projected reduction potential of 6.92 tonCO₂e under the Pathway. This included reductions of 4.15 tonCO₂e in Scope 2 and 0.82 tonCO₂e in Scope 3. Although the achieved reduction was below the projected potential, the results demonstrate the project’s contribution to mitigating environmental impacts associated with electricity consumption.
In conclusion, the Solar Lighting project represents a practical measure that supports the Company’s GHG reduction targets through the use of clean and renewable energy. It also serves as an important foundation for enhancing energy management efficiency and advancing the organization toward sustainable business operations in the long term.
Summary of the Greenhouse Gas Emission Reduction Project
The Company has systematically implemented greenhouse gas (GHG) emission reduction initiatives, establishing 2022 as the base year and developing a Pathway to support business growth alongside environmental impact mitigation. In 2024, which marked the first year of the Pathway, the Company had a total GHG reduction potential of 336 tonCO₂e from various projects and achieved an actual reduction of 276 tonCO₂e. Although the results were below the projected target, they reflect meaningful progress in the initial implementation of key measures amid business expansion in terms of revenue and production capacity. In 2025, the Company further enhanced the efficiency of its GHG reduction initiatives, achieving an actual reduction of 380 tonCO₂e, which is close to the Pathway target of 402 tonCO₂e. This performance demonstrates tangible improvements in energy efficiency, production processes, and supporting activities. It also provides a strong foundation for driving the organization toward its long-term goal of achieving net-zero greenhouse gas emissions.
Summary of Greenhouse Gas Emission Reduction Projects 2024 – 2025 compared to the base year 2022
| Report Topics | Years of operation | ||||||
|---|---|---|---|---|---|---|---|
| Base Year | Pathway 2025 Year 1 | Pathway 2025 Year 2 | |||||
| 2022 | Pathway | Actual | ส่วนต่าง | Pathway | Actual | ส่วนต่าง | |
| Revenue (Million baht) | 808 | 856 | 1189 | 333 | 880 | 1082 | 202 |
| Product (MVA) | 1149 | 1218 | 1390 | 172 | 1252 | 2153 | 901 |
| GHG Emissions (TonCO2eq.) | 1840 | 1709 | 1935 | 226 | 1643 | 2592 | 949 |
| GHG Reduction Potential (TonCO2eq.) | – | 336 | 276 | (60) | 402 | 380 | (22) |
Pathway to Net Zero (5 Year) Performance Graph
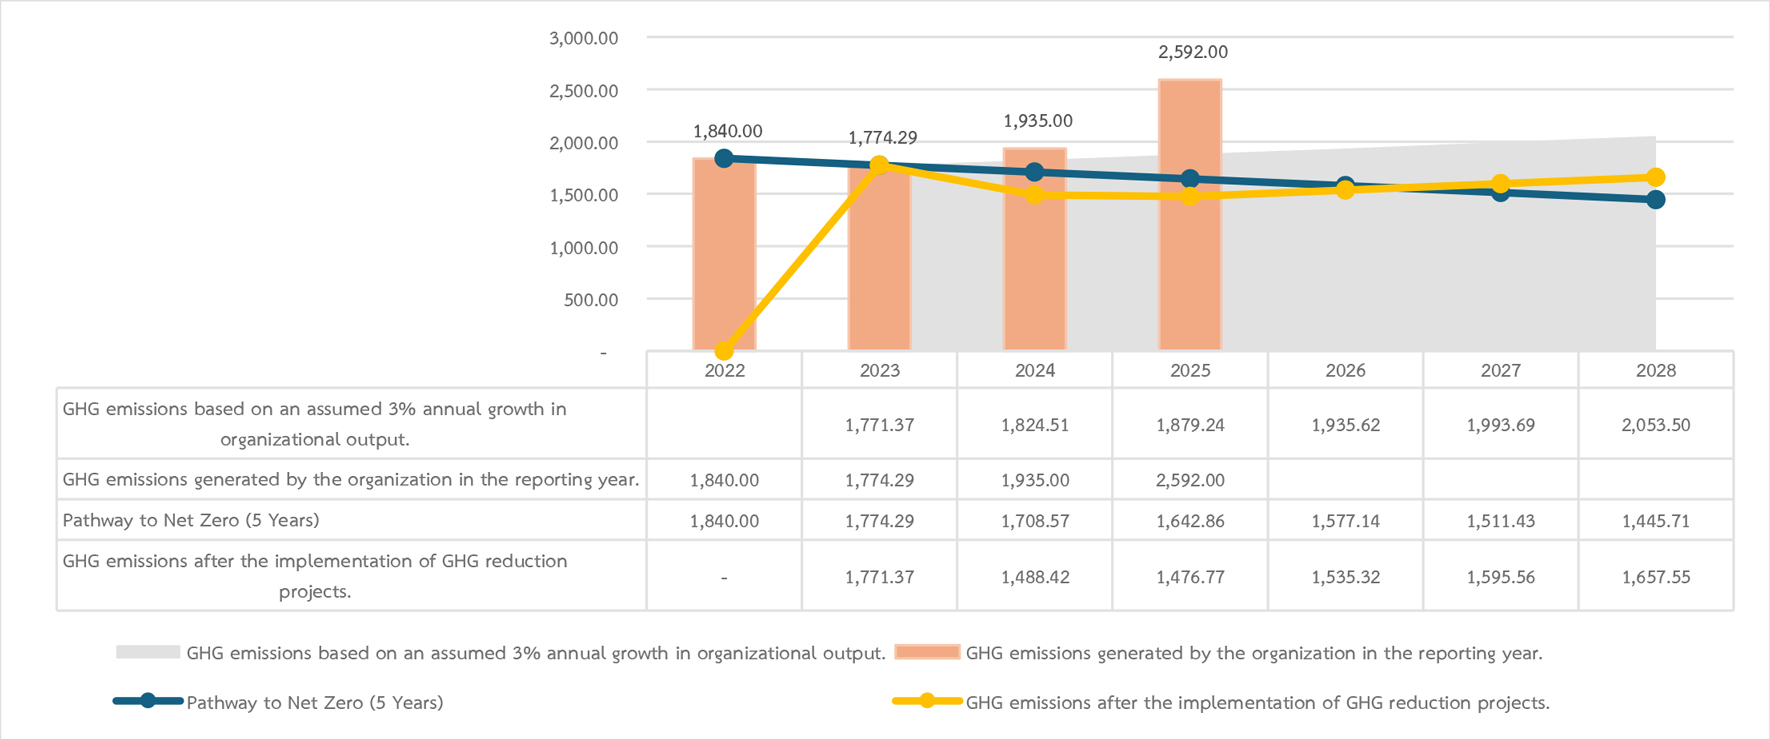
Summary of Performance Pathway to Net Zero (5 Years)
Carbon Intensity per Unit
Based on a comparison of carbon intensity between the base year (2022) and 2025, the Company’s overall production efficiency shows improvement across several dimensions, despite an increase in total greenhouse gas (GHG) emissions in 2025 in line with expanded production activities. Carbon intensity per unit of power capacity (MVA) has continuously decreased from 1.60 tonCO₂eq./MVA in the base year to 1.20 tonCO₂eq./MVA in 2025, reflecting more efficient use of resources and energy in the production process. Similarly, carbon intensity per unit of product weight declined from 0.47 to 0.38 tonCO₂eq./ton, indicating improved process control relative to increased production volume. However, carbon intensity per unit of revenue increased in 2025 compared to the previous year, reflecting changes in revenue structure and operating costs. The Company will use these analytical results to inform systematic planning and the development of measures to further reduce carbon intensity in the future.

Summary of Performance Targets Carbon Neutrality & Net Zero